In 2026–2027, the market standard will no longer be simply having telematics in place. The standard will be managing a fleet as a data system — with a reporting cadence, automation, and measurable decision-making. Organizations that fail to build this maturity will operate reactively: without consistent metrics, without predictability, and without real cost control over the long term.
Fleet management rarely loses control abruptly. In most cases, efficiency deteriorates gradually. The fleet slowly expands while processes fail to keep pace with its growth. Processes fragment across tools, manual work increases, and data loses its coherence. Decisions are made in reaction to incidents rather than on the basis of a steady reporting rhythm. In this model, costs and risks accumulate quietly, and operational predictability comes to depend almost entirely on the experience of individual people.
The following fleet maturity benchmark is a comparative reference for 2026–2027. It is not a ranking, nor an attempt to judge any organization. Its purpose is to allow you to compare your fleet management practices against market-level standards across six areas and to identify the single most important development step worth taking first.
.png)
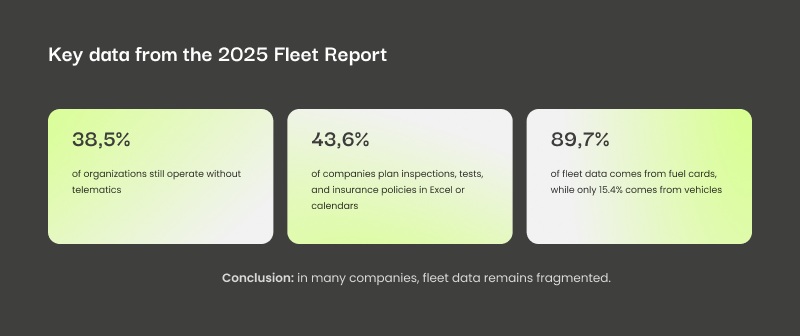
The starting point is clear: in many organizations, fleet data remains fragmented and the full picture of costs is incomplete. Research conducted for the Fleet Report shows that:
- 38.5% of organizations still operate without telematics
- 43.6% of companies manage key processes (including inspections, technical reviews, and insurance policies) in Excel or calendar tools
- In the area of fuel, single data sources dominate — 89.7% rely primarily on fuel cards, with low utilization of vehicle data (15.4%)
In this configuration, Excel stops being a "system." It becomes an ad hoc tool that provides no auditability, consistency, or speed of response.
Each area of the benchmark concludes with a single business insight and a recommended next step — making it straightforward to translate results into operational decisions and an action plan.
1. Telematics and operational data
Behind the market
Telematics is absent or deployed in isolation, with no meaningful impact on decisions. Data on utilization, driving behavior, and fuel consumption is fragmented — available "on request" or only after an incident. Operational decisions rely primarily on user declarations and manual summaries.
Business insight: There is no consistent operational visibility, meaning costs and risks only become apparent once they have escalated.
Business consequence: When inspection, review, and insurance schedules "live" in Excel, the fleet becomes dependent on a single individual, and the risk of costly delays and unplanned downtime grows.
Recommended next step: Launch telematics as a permanent data source for a weekly report (minimum: mileage, utilization, events) on a pilot covering 20–30% of the fleet.
At market level
Telematics is operational but used primarily for vehicle location and basic reporting. Analytical features (fuel consumption, correlations, driver scoring) are used occasionally. Data supports operations but rarely drives changes to fleet rules or policies.
Business insight: Visibility exists, but it does not consistently translate into decisions and process corrections.
Business consequence: Telematics improves operational control, but without a steady data-working rhythm, its potential remains untapped.
Recommended next step: Establish a consistent data rhythm — a weekly operational report and a monthly cost report built around 3 KPIs, with clearly defined action owners (who is responsible for what, and by when).
Ahead of the market
Telematics covers the fleet in a deliberate way (with exceptions driven by HR or GDPR considerations). Data feeds regular reports, and results are routinely discussed with line managers. Drivers have visibility into their own data, which increases system acceptance and supports behavioral change.
Business insight: Telematics functions as fleet management infrastructure, not merely a monitoring tool.
Business consequence: Regular work with data changes driver behavior and reduces operational risks — including incidents, misuse, and disputes over vehicle usage.
Recommended next step: Add a "data-driven management" layer — a simple driver scoring system and regular conversations or training sessions based on trends (e.g., monthly), rather than individual events.
2. Service, compliance, and administration (insurance, inspections, maintenance)
Behind the market
Excel, calendars, and "tribal knowledge" are the primary planning systems. Alerts are informal, or there is no centralized view of vehicle status. The risk of missed deadlines for inspections, insurance policies, and maintenance is real and recurring.
Business insight: Compliance and fleet continuity depend on manual oversight and the knowledge of individual people.
Business consequence: Even one missed deadline — a policy, inspection, or service — can take a vehicle out of operation, creating unplanned downtime and formal liability that is difficult to defend in an audit.
Recommended next step: Migrate 100% of scheduling (insurance, inspections, maintenance) into a system and set up automatic alerts based on date and mileage.
At market level
A fleet system is the primary tool, but email and Excel continue to operate in parallel. Deadlines are usually met, but at the cost of manual data synchronization. Responsibility for responding to alerts is often unclear.
Business insight: The process works, but generates hidden costs through manual effort and duplicated tasks.
Business consequence: With multiple communication channels and unclear accountability, the risk of delayed responses to alerts increases. The result is unnecessary downtime, firefighting costs, and reduced fleet predictability.
Recommended next step: Turn alerts into tasks. Every alert should trigger a workflow with an owner, a deadline, a status, and a simple escalation path in the event of no response.
Ahead of the market
The entire process runs within a single system with automated scheduling. Service confirmations come through from CFM providers or service networks without manual re-entry. Delays are measured and reported, and the fleet manager fulfills a supervisory rather than an administrative role.
Business insight: Fleet administration and compliance are predictable and resilient to staff turnover.
Business consequence: Automated scheduling and partner integrations reduce manual work, decrease the incidence of errors, and stabilize fleet availability. The process also becomes easy to audit.
Recommended next step: Add integrations that reduce manual work — for example, automated service events or service confirmations from CFM providers, leasing companies, or service networks.
3. Fuel
Behind the market
Fuel is reconciled primarily on the basis of invoices and aggregate reports. There is no verification of transactions in their operational context (route, mileage, vehicle utilization). Misuse and errors surface only during an audit or when costs spike unexpectedly.
Business insight: Fuel is a cost that cannot be corrected quickly because there is no mechanism for early anomaly detection.
Business consequence: Without real-time transaction verification, costs can "leak" for weeks. Corrections happen after the fact, increasing losses, the number of billing disputes, and budget unpredictability.
Recommended next step: Implement two simple control rules: refueling outside the planned route, and fuel consumption deviation for a selected vehicle segment (e.g., the highest fuel-cost vehicles).
At market level
Fuel cards are the primary data source, and controls are performed in periodic reviews. Responses occur mainly in extreme cases. There is no consistent correlation of fuel data with mileage or telematics.
Business insight: Fuel control is reactive and does not capture the "grey zone" of minor losses.
Business consequence: When analysis relies solely on fuel cards, the company quietly loses money on small deviations. Without linking data to mileage and vehicle utilization, systematic detection of misuse and inefficiency is difficult.
Recommended next step: Add a second data source (telematics or vehicle readout) and introduce a monthly sanity check: fuel transactions versus mileage and vehicle utilization.
Ahead of the market
Fuel data is verified from at least two sources (fuel card plus telematics or vehicle data). Deviations are analyzed on a regular basis, and insights feed into fleet usage policies and driver conversations.
Business insight: Fuel is a managed operational process, not merely a report to be reviewed.
Business consequence: Through regular deviation analysis, fuel becomes a controllable cost. The organization can detect losses earlier, correct driver behavior, and stabilize the budget rather than reacting only when costs spike.
Recommended next step: Automate anomaly detection (thresholds, exceptions, vehicle segments) rather than manually reviewing data across the entire fleet.
4. Mileage (recording and data quality)
Behind the market
Mileage records are absent, or data is sparse and inconsistent. Tax reconciliations and decisions are based primarily on caution rather than on data. There is no basis for planning services and replacements according to actual vehicle utilization.
Business insight: Without reliable mileage data, tax risks increase and cost control across the vehicle lifecycle becomes severely limited.
Business consequence: Without consistent mileage records, the organization operates blind. The risk of tax and billing errors grows, and service and replacement planning is suboptimal — raising TCO and the frequency of unplanned downtime.
Recommended next step: Introduce a single source of truth for mileage (telematics or vehicle readout) along with data validation rules: gaps, sudden spikes, and illogical values.
At market level
Mileage is collected, but partially manually or not across the full fleet. Data is operationally useful but often delayed and requires corrections.
Business insight: Mileage records exist, but their quality limits automation and the reliability of decisions.
Business consequence: When mileage is partially manual and delayed, the organization loses time to data corrections. Service and billing decisions rely on data of limited reliability, increasing administrative costs and the risk of errors.
Recommended next step: Automate at least 80% of mileage capture (e.g., via telematics or vehicle readout), reserving manual correction for exceptions only.
Ahead of the market
Mileage is fully automated and linked to cost reports and VAT reconciliation. Mileage data is consistent with fuel and service information.
Business insight: Mileage becomes the data backbone of the fleet, bringing order to costs and reducing manual work.
Business consequence: With consistent, automated mileage linked to fuel and service data, the organization can forecast costs and plan services in advance. This reduces downtime and stabilizes TCO, rather than reacting only after breakdowns occur.
Recommended next step: Add data quality rules (alerts for mileage gaps and spikes) and use mileage data to forecast services and replacements.
5. Car sharing and fleet utilization
Behind the market
The dominant model is "assigned vehicle," even when cars sit unused most of the time. There is no data on actual vehicle utilization or mobility demand. It is impossible to quantify the potential for reducing fleet size or shifting vehicles to a shared pool.
Business insight: The fleet may be oversized, but without utilization data it is not safe to make structural changes.
Business consequence: Without utilization data, the organization maintains a fixed fleet cost that it cannot consciously optimize. Any attempt to reduce fleet size "by feel" risks availability gaps and conflict with business stakeholders.
Recommended next step: Introduce a basic vehicle pool (even as a pilot) with an availability calendar and monitor two core KPIs: utilization rate and mileage.
At market level
A booking system or "keys at reception" model is in place with basic records. It is clear which vehicles belong to the shared pool, but decisions about fleet size do not always stem from data.
Business insight: Car sharing works organizationally, but has not yet translated into fleet structure optimization.
Business consequence: With car sharing based on basic records, the organization does not fully exploit the potential for cost reduction and better vehicle count optimization. Without hard data on time utilization and mileage, decisions are still made intuitively.
Recommended next step: Add digital vehicle handover and return confirmation along with a monthly pool utilization report (time and mileage) to enable data-driven decision-making.
Ahead of the market
Car sharing operates within a system featuring formal booking, confirmations, and assigned user responsibility. Vehicle utilization is measured, and fleet decisions are grounded in data analysis. The system is integrated with telematics and reporting.
Business insight: Car sharing becomes a tool for managing mobility demand and the total cost of fleet ownership.
Business consequence: Through utilization measurement and telematics integration, the organization can actively match vehicle count to real demand — reducing TCO while increasing availability where vehicles are genuinely needed.
Recommended next step: Use the data to make one concrete optimization decision — for example, reducing or relocating a portion of the fleet based on utilization data.
6. Safety and driving behavior
Behind the market
Action is taken primarily after incidents or fines, with no real preventive mechanism. Driving behavior data is not linked to fuel costs, service costs, or claims history. Telematics (where present) functions mainly as an event recorder. There is no systematic safe driving training program.
Business insight: The costs of incidents and operational risks grow gradually because there is no consistent prevention mechanism or link between driver behavior and TCO or insurance costs.
Business consequence: Without prevention and driving style analysis in the context of repair, downtime, and claims costs, the organization pays more over time. Problems only become visible after incidents, while budget and operational risk deteriorate steadily.
Recommended next step: Choose one safety metric (e.g., speeding or number of events) and launch a monthly trend review with a straightforward process for manager conversations.
At market level
Driving style monitoring is in place, but responses are mostly reactive. Training programs exist but without systematic measurement of outcomes.
Business insight: Safety-related activities generate costs, but their real impact on fleet results is difficult to demonstrate.
Business consequence: Without a consistent rhythm of analysis and outcome measurement, the organization invests in safety without visibility. Training costs are certain; the impact on claims, fines, and fuel consumption remains undocumented.
Recommended next step: Connect training to data: driver scoring → training → outcome measurement after 3 months (fuel consumption, claims, fines).
Ahead of the market
Safety is embedded in KPIs and regular conversations with line managers. Coaching and training are cyclical and measured. Reward mechanisms complement — rather than replace — corrective ones.
Business insight: Safety functions as a risk management process, not merely a response to incidents.
Business consequence: When safety is part of KPIs and regular coaching, the organization systematically reduces incidents and fines. This stabilizes costs and fleet availability rather than generating unpredictable post-incident expenditure.
Recommended next step: Integrate risk with cost — introduce a single report combining driving style, fuel consumption, and claims to create a unified basis for decisions.
Translating the benchmark into action
The benchmark result is best treated not as an assessment, but as a tool for prioritizing actions. The greatest value comes from identifying two or three areas where the organization is behind the market and where the gap has the greatest impact on costs, operational risk, or fleet continuity. These areas should be translated into a backlog of actions for the next 12–24 months — beginning with one concrete development step in each.
In practice, organizations that go through this process reach the level of operational maturity that defines the fleet management standard for 2026–2027: telematics operates as a data infrastructure, service scheduling, inspections, and insurance renewals are automated, fuel and mileage are controlled consistently, and fleet utilization and safety are managed on the basis of measurable indicators.
In this model, the fleet ceases to be a collection of vehicles and fragmented processes. It becomes the organization's mobility system — predictable, measurable, and resilient to staff turnover or organizational change. This is precisely the level of operational maturity that represents the new standard in fleet management today.
.png)
Assess your fleet's maturity level
If you would like to find out where your fleet stands, the benchmark can be worked through together in the form of a short diagnostic conversation. In 30–45 minutes, we examine the six areas of fleet management and identify the two or three elements that most commonly have the greatest impact on costs, operational risk, or team workload.
For many organizations, this is the first step toward bringing order to fleet management through a data-driven model — rather than relying on fragmented tools and manual work.